In a digital world, AI has emerged as the backbone of overhauling the face of market research and business strategies. The rising demand for real-time data analytics and AI-driven insights directly reflects the digital transformation that is gaining momentum both in India and worldwide. Businesses apply AI as a method of getting ahead in the competition by understanding the behaviour of the customer, optimizing their services, and even making decisions in real time. This is dramatically changing the game for traditional consulting and market research whereby one is compelled to rely on data-driven strategies as a necessity. These AI technologies enable businesses to be on top of actionable insights more quickly than ever before, which makes them foundational for scaling operations and improving the customer experience.

Sprinklr: Driving Market Insights and Strategy
Sprinklr is that AI-powered platform, emerging as a tool a business needs to access deep market insights. Market research companies make use of the platform for analyzing data from numerous sources, social media to customer feedback surveys, hence, to provide them with live insights. These insights help businesses find out customer sentiments, and track competitor strategies, and emerging trends. It enables businesses to track and respond to change almost in real-time, which makes them able to change their strategy on the fly. Through Sprinkler, businesses can look beyond reactive strategies and tackle opportunities proactively by using data that is ahead of the trend to guide decisions.
Case Study: How Sprinklr can be used to Transform Strategy
Key Use Cases:
- Competitor Benchmarking and Trend Identification: Sprinklr’s AI allows to track continuously how trends are emerging across social media as well as their competitors. The service aggregates data and does sentiment analysis, which means can understand what makes brands successful. Such insight shapes the consulting advice to inform the clients accordingly, allowing them to act proactively on positioning in the market.
- Predictive Market Insights for Strategic Advisory: With AI-powered forecasting capabilities, Sprinklr allows you to predict upcoming trends and consumer demands. This enhances the firm’s ability to provide forward-looking insights to clients, ensuring that businesses remain aligned with market expectations and avoid becoming reactive to changes.
- Actionable Insights for Market Entry Strategies: Can use the granular market insights from Sprinklr to identify segments, assess competition, and then craft go-to-market approaches for entry into new markets for businesses focused on entering new markets. This reduces the risk of entry by using data-backed recommendations.
- Integration of Sprinklr: Sprinklr was integrated into the customer feedback and market analysis process. This integration would enable gathering and immediate analysis of data using the AI capabilities of Sprinklr, as observed in social media, website reviews, and customer engagement on services. This gave the firm a better understanding of customer pain points, such as product quality and delays in deliveries.
Step-by-Step Process:
- Data Collection: Sprinklr aggregated data from several channels, which include social media mentions, customer reviews, and support tickets. The AI filtered only the relevant feedback.
- Sentiment Analysis: Using its AI-driven sentiment analysis feature, the platform categorized the feedback into positive, neutral, and negative. The firm was then able to identify issues that needed urgent attention.
- Identifying trends: Sprinklr’s digital analytics capabilities helped identify key areas of concern for an e-commerce firm operating in the online apparel retail sector. Common complaints included “poor stitching quality,” “fabric not matching the description,” “incorrect sizes delivered,” and “excessive delays in shipping orders.” For instance, customers frequently commented, “The dress I received doesn’t match the image on the website,” or “I’ve been waiting for over two weeks for my delivery, and the tracking status hasn’t changed.”
- Such insights highlight specific pain points that the company needed to address—improving product quality, ensuring size accuracy, and optimizing shipping logistics.
- To gain a deeper understanding, digital analytics can be effectively combined with primary surveys. For example, surveying customers post-purchase can reveal if dissatisfaction stems from specific suppliers, certain product categories, or seasonal demand spikes. This blend of digital and survey-driven insights can help companies uncover the root causes of customer dissatisfaction and implement actionable strategies for improvement.
Key Observations:
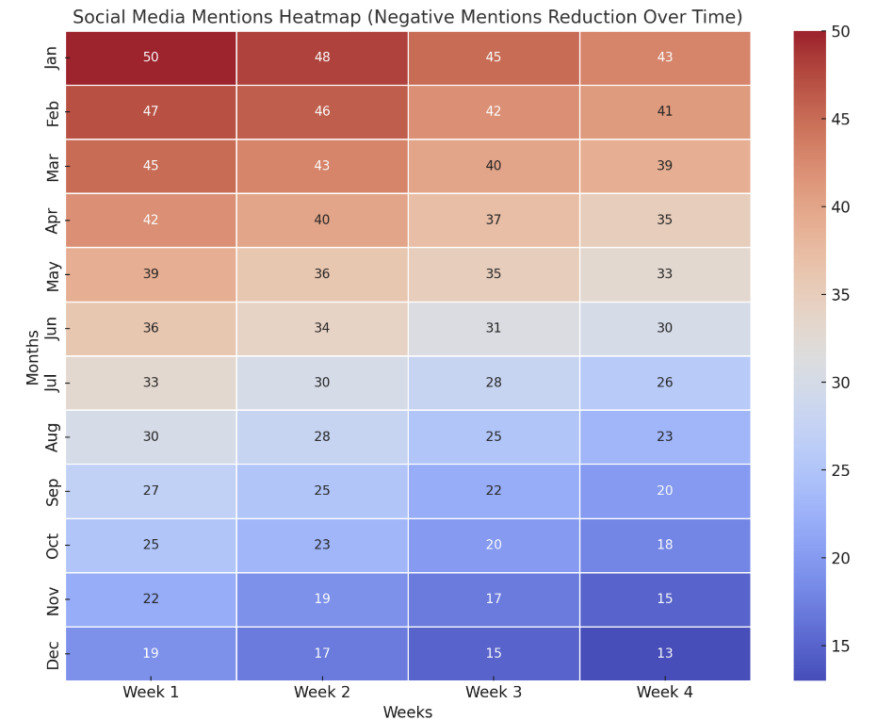
- January and February: These months have the highest concentration of negative mentions, starting at 50 in Week 1 of January. The gradual decrease to 43 by Week 4 of February suggests the company might have started taking corrective actions to address customer concerns.
- Mid-Year Transition (March to June): A noticeable reduction in mentions is observed, with March beginning at 45 and June ending at 30. This decline could be attributed to ongoing efforts like product improvements, better customer service, or addressing shipping delays.
- Sustained Improvement (July to October): The number of negative mentions continues to decline steadily. By October, mentions have dropped to 18 by Week 4, signalling that the company’s strategies to mitigate complaints are showing consistent results.
- Low Negative Mentions (November to December): In the last two months, the negative mentions are at their lowest, with December Week 4 recording only 13 mentions. This reflects a significant improvement compared to January and suggests a successful resolution of major issues.
- Strategy Refining: With these findings at hand, the e-commerce company could continue to refine the product on offer by ‘scrapping unpopular ones’ and the logistics made smoother. The real-time feedback by Sprinklr enabled the company to rapidly change course as new concerns arose.
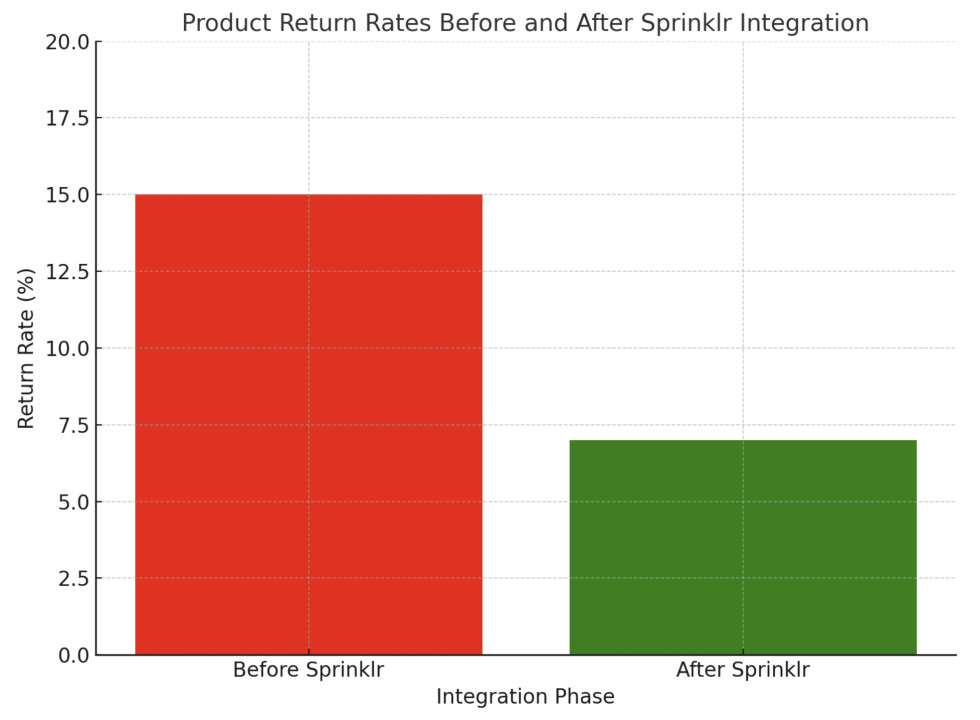
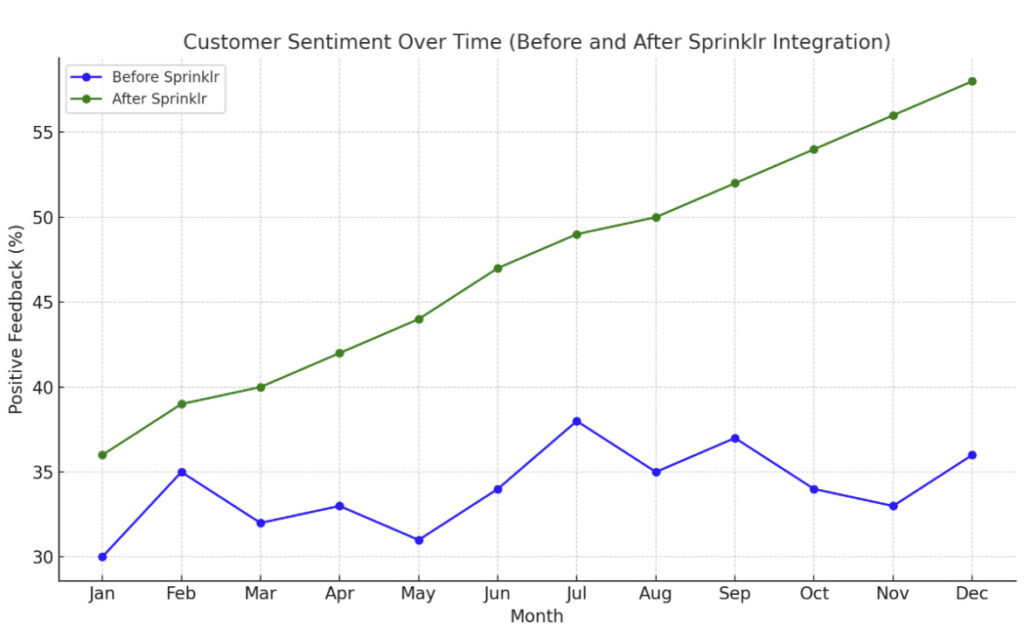
- Implementation and Results: The company implemented these findings into its operational strategy. Scores for customer satisfaction improved within months, return rates for products dropped, and positive reviews on major platforms increased.
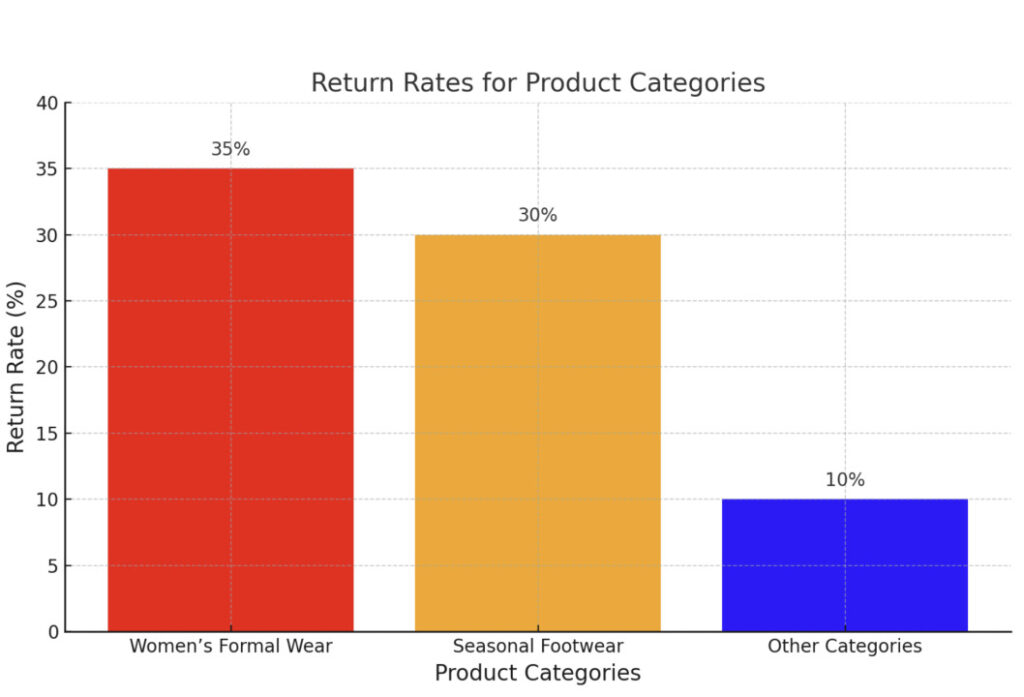
Here is the bar chart visualizing the return rates for different product categories:
- Women’s Formal Wear has the highest return rate at 35%.
- Seasonal Footwear follows with a 30% return rate, attributed to complaints about size mismatches.
- Other Categories have a much lower average return rate of 10%

Here is a heatmap visualizing customer complaints across product categories and regions:
- Tier-2 Cities recorded the highest number of complaints overall, particularly for Footwear (18 complaints) and Formal Wear (15 complaints).
- Tier-1 Cities had fewer complaints, but issues with Formal Wear (10 complaints) were notable.
- Tier-3 Cities also showed moderate levels of dissatisfaction, with Footwear receiving 10 complaints.
Key Insights:
- Tier-2 cities experience the most dissatisfaction, likely due to logistics delays or quality inconsistencies.
- Footwear and Formal Wear categories are the most problematic across all regions.
That is how Sprinklr can lead companies through the adaptation of AI-driven tools to upgrade their market strategies. From real-time data collection to actionable insights, Sprinklr changes the way that businesses will react to customer feedback.

